NASA satellite measurements show parts of the San Francisco Bay Area sinking, increasing local flood risk
What the satellite record shows
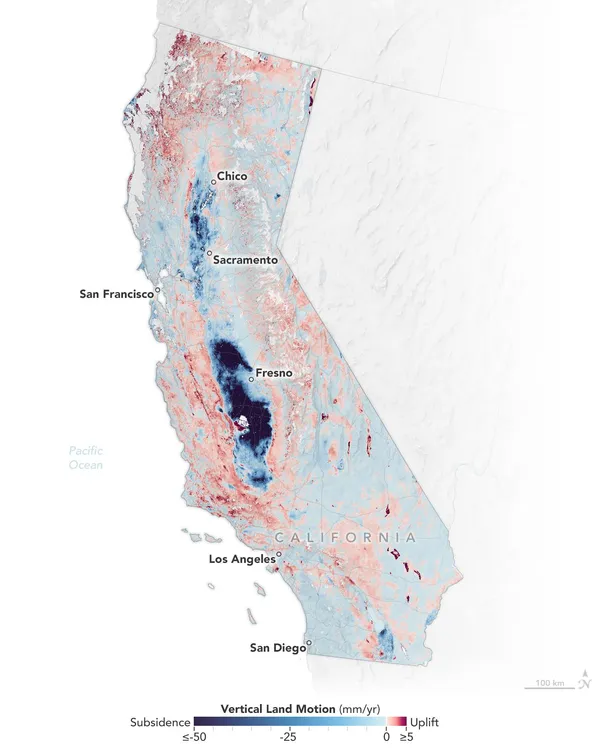
Parts of the San Francisco Bay Area are experiencing measurable ground subsidence, a slow lowering of the land surface that can compound the impacts of sea-level rise and coastal flooding. A NASA-led analysis using satellite radar techniques mapped vertical land motion along the California coast between 2015 and 2023, revealing that sinking is not uniform: stable areas can sit near localized “hotspots” where the ground is dropping faster.
In the Bay Area, the highest sustained rates identified in the coastal study were concentrated in four shoreline communities: San Rafael, Corte Madera, Foster City, and Bay Farm Island in Alameda. In those locations, the land was found to be subsiding at a steady rate exceeding 10 millimeters per year (about 0.4 inches). The study linked much of that motion to sediment compaction—an issue that can be pronounced in low-lying bay margins with soft, water-saturated deposits.
Why subsidence matters for flood planning
Subsidence effectively raises local sea level because it lowers the ground relative to the waterline. Even when the sinking rate appears modest, the combination of land drop and rising seas can shift the frequency and extent of tidal inundation and storm-driven flooding, particularly in areas close to today’s high-tide elevation.
Earlier Bay-focused research integrating satellite radar and ground-based positioning data found that, along much of the shoreline, subsidence is generally under 2 millimeters per year. But that same body of work emphasized that localized sinking—especially in areas underlain by young sediments or artificial fill—can substantially expand the footprint of future inundation compared with maps that account for ocean rise alone.
Where the vulnerability concentrates
Bayfront neighborhoods built on reclaimed wetlands or fill often face a dual challenge: softer ground prone to compaction and low elevations that leave little buffer during extreme tides. Critical transportation and utility corridors in shoreline zones may also be exposed, because differential subsidence—where adjacent blocks sink at different rates—can stress pavements, buried pipelines, and foundations.
- Hotspots of faster sinking have been identified in parts of San Rafael, Corte Madera, Foster City, and Bay Farm Island.
- Many of the most vulnerable bay-margin areas overlap with soft sediments and historically modified shorelines.
- Inundation projections can change materially when vertical land motion is added to sea-level rise scenarios.
How scientists measure sinking from space
The coastal mapping relies on interferometric synthetic aperture radar (InSAR), a technique that compares repeated satellite radar observations of the same ground surface to detect tiny changes in elevation over time. The approach can identify broad regional trends as well as neighborhood-scale variation, then is cross-checked with ground-based navigation satellite receivers where available.
Subsidence is often invisible day to day, but it can shape long-term flood exposure by lowering the land surface relative to tides and storm surges.
What comes next for the Bay Area
For local governments and infrastructure operators, the emerging picture is that adaptation planning needs to incorporate both ocean-driven sea-level rise and land-driven elevation change. That includes updating risk assessments for shoreline protection, drainage capacity, and critical facilities in low-lying zones where subsidence is persistent and spatially uneven.