San Francisco traffic congestion surged in 2025 as downtown activity returned, placing the city near top nationwide
San Francisco joins the country’s most congested urban cores
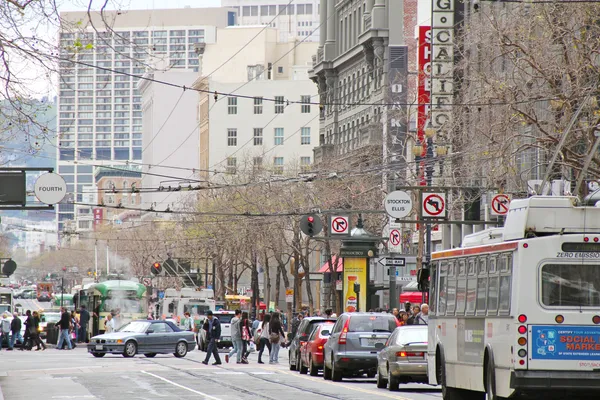
San Francisco ended 2025 among the most congested U.S. cities as downtown activity continued to rebuild, bringing more vehicles into a street network shaped by narrow rights-of-way, frequent signals, and heavy pedestrian activity. Traffic analytics for 2025 place San Francisco in the top tier nationally for congestion, alongside Honolulu and Los Angeles, reflecting a measurable shift in travel conditions in the city’s densest areas.
Across 2025, city-center driving speeds averaged about 12.6 miles per hour, and travel times ran roughly 50% longer than free-flow conditions. The same dataset shows an average congestion level near 50%, with the 2025 average higher than 2024 by a little more than two percentage points. In practical terms, a typical 10-kilometer (about 6.2-mile) drive in San Francisco averaged roughly 29 minutes and 42 seconds in 2025, longer than the prior year’s average for the same distance.
How congestion is measured — and why rankings can differ
Congestion rankings depend heavily on methodology. City-center indices typically focus on a defined “urban core,” where trip density is highest and where delays accumulate at intersections and on lower-speed arterials. This approach can yield results that look different from regional commute-time studies that emphasize freeway corridors, longer trips, or metro-wide averages.
Different traffic reports also emphasize different metrics. Some center on “congestion level” (the percent increase in travel time versus free-flow), while others highlight “time lost” during peak commuting windows, which is sensitive to trip patterns and peak-hour definitions. For San Francisco, both perspectives point in the same direction: slower average speeds and more time absorbed by stop-and-go conditions in 2025.
The time cost: peak-hour delays add up
One widely used benchmark for comparability is a repeated peak-hour commute. Under that framing, San Francisco drivers who routinely travel at morning and evening peak times lost roughly 112–116 hours over the year to congestion—close to three standard work weeks. These estimates are designed to represent a consistent “typical” commuter experience rather than every trip taken across all times of day.
Average city-center speed in 2025: about 12.6 mph
Average congestion level in 2025: about 50%, higher than 2024
Typical 10 km trip in 2025: about 29 minutes 42 seconds
Estimated annual time lost for a peak-hour commuter: roughly 112–116 hours
What the numbers suggest about downtown’s recovery and the transportation mix
Rising congestion is consistent with increased activity in and around the city’s core: more in-person workdays, more visitor travel, and more commercial deliveries. It also highlights a continuing tension in San Francisco’s transportation system: when transit capacity, reliability, and coverage do not fully match where and when travel demand returns, traffic delay becomes the default “pressure valve” for the street network.
San Francisco’s 2025 traffic data shows worsening city-center speeds and higher congestion compared with 2024, aligning with a broader rebound in downtown travel demand.
Policy responses under discussion across major U.S. cities range from transit investment and operational improvements to pricing strategies that manage demand in the most crowded zones. In San Francisco, the 2025 figures provide a data point for evaluating how the city’s recovery intersects with mobility, curb space competition, and the capacity of alternatives to driving.